Labels Examples
Labels here labels there, labels everywhere.
Labels
Labels can add a lot to a chart, and as such there are a few options to customize them.
Basic Labels
The simplest label type is just plaintext, supplied as an array to the labels option. This is seen in each chart example page.
barchart({
  data: [50, 100, 30],
  labels: ['1st', '2nd', '3rd'],
});
The same works for line charts:
linechart({
  data: [
    [50, 100, 40],
    [10, 20, 5],
    [90, 80, 70],
  ],
  labels: ['1st', '2nd', '3rd'],
});
And barchartStacked:
barchartStacked({
  data: [
    [50, 100, 30],
    [20, 40, 10],
    [10, 20, 5],
  ],
  labels: ['1st', '2nd', '3rd'],
});
Label Styling
Labels can be styled with the labelClass option, which accepts a string that will be added to each resulting <text> element.
And with that you can use CSS to add any styling you want!
Note that these are SVG elements, so CSS properties that don't apply to SVG elements won't work here!
For example, color won't work, but fill will. Here's a helpful resource on CSS & SVG
barchart({
  data: [50, 100, 30],
  labels: ['1st', '2nd', '3rd'],
  labelClass: 'my-bar-labels',
});
Data Labels
But what if you just want datalabels? No problem! There's two options for this:
dataLabels: 'literal' // or 'percentage'- This will use the data values as labels placed on each bar/point- or you can pass an array of the numbers you want as labels to
labels
barchart({
  data: [50, 100, 30],
  dataLabels: 'literal',
});
The "percentage" option will calculate the percentage of each bar relative to the total of all bars, and display that instead:
barchart({
  data: [50, 100, 30],
  dataLabels: 'percentage',
});
You can also use datalabels along with normal labels:
barchart({
  data: [50, 100, 30],
  dataLabels: 'percentage',
  labels: ['A', 'B', 'C'],
});
Image Labels
Image labels are also supported! To use them, you can pass an array of objects to the imageLabels argument, which accepts the following properties:
type ImageLabel = {
  href: string;
  alt: string;
  topText?: string;
  bottomText?: string;
  height?: number;
  width?: number;
};
Let's see an example:
barchart({
data: [50, 100, 30],
imageLabels: [
{
href: '/imgs/misc/test.jpg',
alt: 'Skull',
height: 25,
width: 25,
},
{
href: '/imgs/misc/test.jpg',
alt: 'Skull',
height: 25,
width: 25,
},
{
href: '/imgs/misc/test.jpg',
alt: 'Skull',
height: 25,
width: 25,
},
],
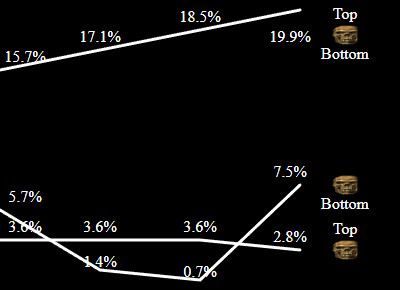
});You can also add text above or below the image with the topText and bottomText properties:
linechart({
  data: [
    [50, 50, 50, 40],
    [80, 20, 10, 105],
    [220, 240, 260, 280],
  ],
  imageLabels: [
    {
      href: '/imgs/misc/test.jpg',
      alt: 'Skull',
      height: 25,
      width: 25,
      topText: 'Top',
    },
    {
      href: '/imgs/misc/test.jpg',
      alt: 'Skull',
      height: 25,
      width: 25,
      bottomText: 'Bottom',
    },
    {
      href: '/imgs/misc/test.jpg',
      alt: 'Skull',
      height: 25,
      width: 25,
      topText: 'Top',
      bottomText: 'Bottom',
    },
  ],
});
Class & Styling Options
To see available class names for styling check out the various API pages for each chart type: