Barchart Examples
The first chart type
barchart
Loads of examples!
Just a reminder that currently barchart returns and SVG, so to use the output you'll want to add it to the DOM however your framework of choice handles it.
const myChart = barchart({
  data: [50, 100, 30],
});

document.body.appendChild(myChart);
For brevity, I'll show just the function calls!
From Quick Start
The most basic possible usage:
barchart({
  data: [50, 100, 30],
});
Adding some labels:
barchart({
  data: [50, 100, 30],
  labels: ['1st', '2nd', '3rd'],
});
And let's place it on the top:
barchart({
  data: [50, 100, 30],
  labels: ['1st', '2nd', '3rd'],
  placement: 'top',
});
Larger Data Values
If one bar is far larger than the others, the resulting zoomed out to fit the largest bar, showing a sense of scale.
barchart({
  data: [50, 1000, 100],
  placement: 'left',
});
Placed on the top:
barchart({
  data: [50, 1000, 100],
  placement: 'top',
});
Coloring
Adding colors is straightforward too!
Basic Coloring
Below only 2 colors are provided, but 3 datapoints are given. When there are less colors than datapoints, the colors will alternate for the remaining datapoints.
barchart({
  data: [100, 50, 100],
  placement: 'top',
  colors: ['#ff00ff', '#00ffff'],
});
Gradients
Providing a few colors in the gradientColors array will result in each bar getting a linear gradient with evenly spaced stops based on the number of colors given.
In the below example I've set the resulting SVG's height & width to be the same as datapoints to show the colored bars.
barchart({
  data: [100, 100, 100],
  placement: 'left',
  gradientColors: ['#ff00ff', '#00ffff'],
  gradientDirection: 'left-to-right', // the default is 'left-to-right'
  width: 110,
  height: 110,
});
The linear gradient that's created automatically spreads the color stops evenly, from the start of the array of colors to the end. So giving it two colors like above results in stops like so:
magenta           cyan
0%                100%
<------------------->
The nice thing is that any valid CSS color should work, here's an example using oklch instead:
barchart({
  data: [100, 50, 100],
  placement: 'top',
  gradientColors: [
    'oklch(0.7017 0.3225 328.36)',
    'oklch(0.9054 0.15455 194.769)',
  ],
  gradientDirection: 'top-to-bottom',
});
And another thing I added that I think is pretty cool is having a continuous gradient that's created with a bit of masking!
To do this the gradientMode should be "continuos" & the gradientDirection can be whatever way you want it, here I've set it to match the top-side bar placement.
barchart({
  data: [250, 50, 100, 150, 100],
  placement: 'top',
  gradientColors: [
    'oklch(0.7017 0.3225 328.36)',
    'oklch(0.9054 0.15455 194.769)',
  ],
  gradientDirection: 'top-to-bottom',
  gradientMode: 'continuous',
});
Animation
Because toomanycharts outputs SVG elements, they can be animated! The caveat is that to animate the individual bars, depending on what sort of animation you want to do, you'll need to change the transform-origin for bars after the charts created based on which side they're on. Which sounds more complicated than it is!
Animejs
Let's look at an example, where to have the bars 'grow in' we'll need to do exactly that. I'll use my animation engine lib of choice - animejs !
import { animate, utils } from 'animejs';
import { barchart } from 'toomanycharts';

const growBars = () => {
  utils.set('.el-bar', {
    transformOrigin: 'left center',
    scaleX: 0,
  });

  animate('.el-bar', {
    scaleX: 1,
    duration: 2000,
    ease: 'linear',
  });
};

export default function BasicChart() {
  const basic = barchart({
    data: [50, 100, 30],
    barClass: 'el-bar',
    placement: 'left',
  });

  setTimeout(() => {
    growBars();
  }, 100);
  return basic;
}
Results in:
Breakdown
main.ts is just appending the chart to the page.
script.ts does a few things, here's a commented version of it:
// imports omitted

// Helper function that does the "setup" and then calls the animation itself
const growBars = () => {
  /*
  animejs provide some nice utilities for manipulating the DOM in this kind of way, which I'm using here to set some of the above mentioned properties before the animating begins

  Breakdown:
    1. I'm targeting ".el-bar" as animejs allows for class selectors (among others) as the target.
    2. Because I've set the bars to be on the left down below, the `transform-origin` for the bars needs to moved to the left of each bar.
    3. Setting the scaleX to 0 as a 'starting point' of what will be changing
  */
  utils.set('.el-bar', {
    transformOrigin: 'left center',
    scaleX: 0,
  });

  // Similar to above but this is the actual animation call itself
  animate('.el-bar', {
    scaleX: 1,
    duration: 2000,
    ease: 'linear',
  });
};

export default function BasicChart() {
  // Notice the `barClass` option!
  const basic = barchart({
    data: [50, 100, 30],
    barClass: 'el-bar',
    placement: 'left',
  });

  // This is justDelay the animation until after the element actually exists in the page.
  // It could be a mutationObserver, or intersectionObserver, or some other method of calling `growBars` after the SVG is in the page.
  setTimeout(() => {
    growBars();
  }, 100);
  return basic;
}
Flicker
You may have noticed that there's a bit of a 'flicker' above - this is a known issue. It happens because the order of things as it currently stands, which goes something like:
- Page loads
- Chart created, added to page
- At this point it looks normal with all bars full-width
100msafter,scaleXset to0so now the bars are suddenly gone, causing a flicker
The fix here is simple, and coming soon. I will add a barStyle option which will allow you to set inline styles for each bar, which'll get tacked onto them - avoiding the flicker.
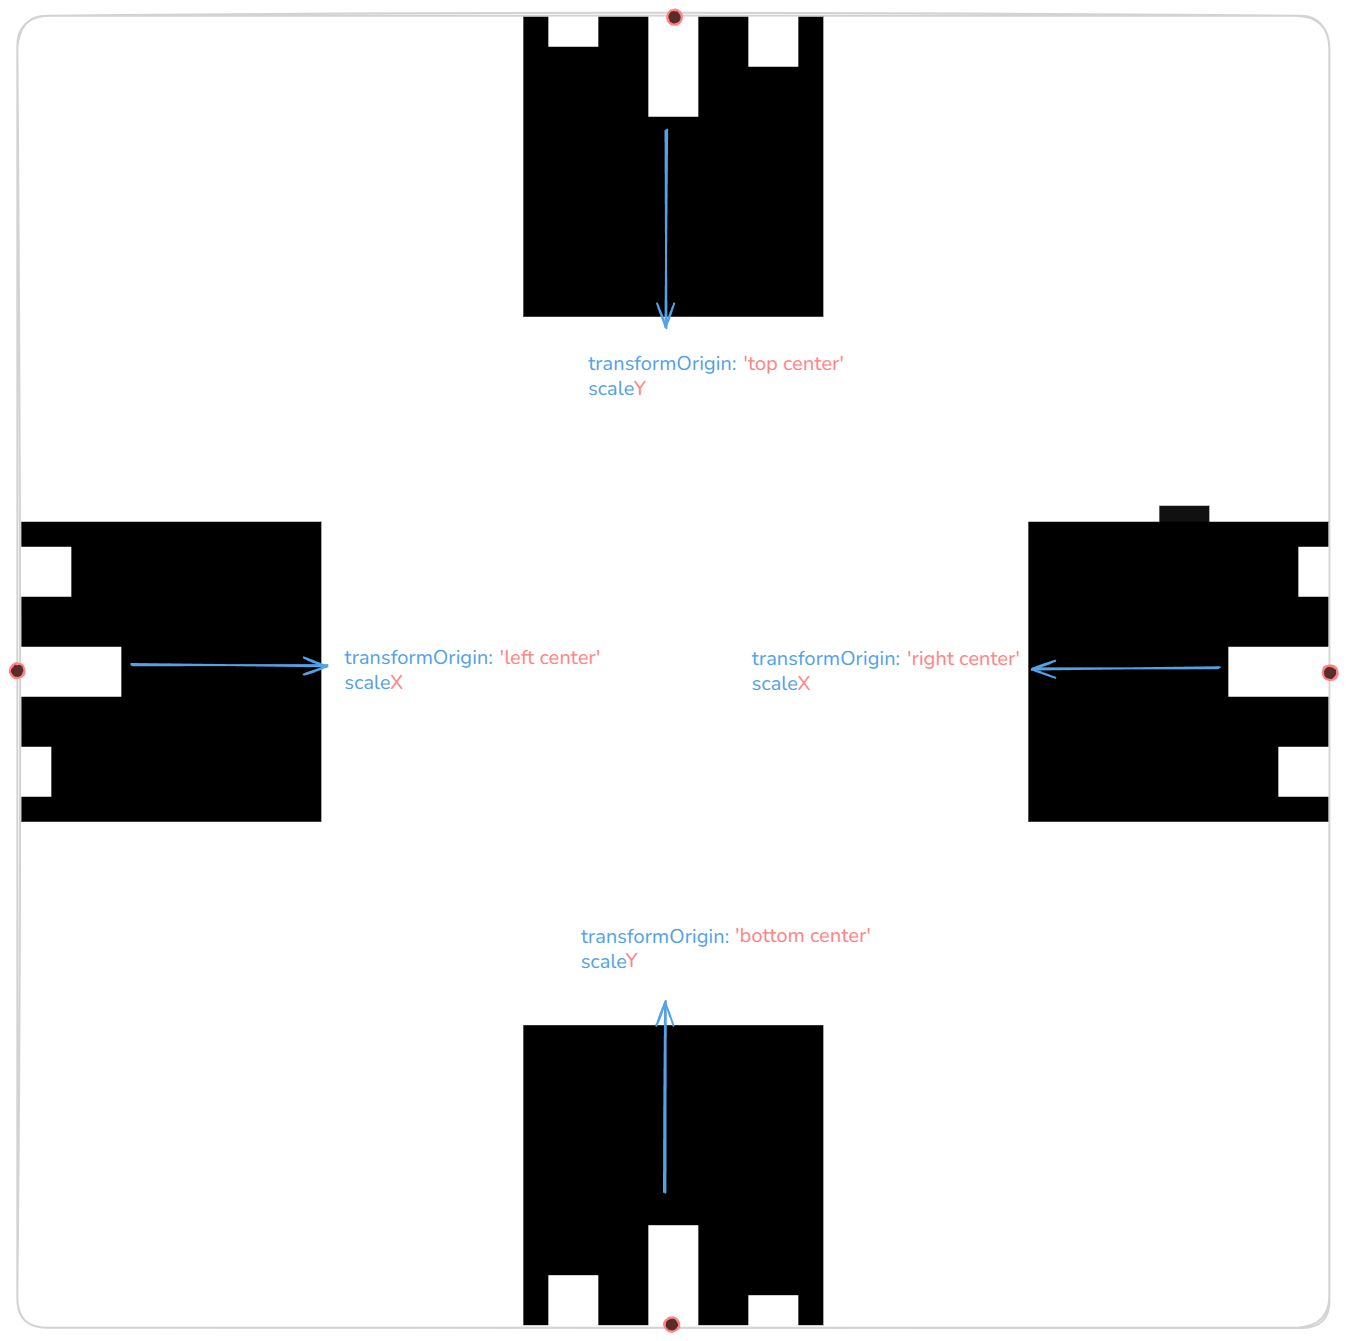
All that being said, the transform-origin is only relevant when you're moving the bars in some way, something like opacity or fill wouldn't require that at all.
transformOrigin guide
Regardless, here's a table & visual guide for all placement options!
| placement | transformOrigin keywords |
|---|---|
| "top" | "top center" |
| "right" | "right center" |
| "bottom" | "bottom center" |
| "left" | "left center" |