Why TooManyCharts?
What's the point of this library?
Motivation
Chart
/CHärt/> a sheet of information
in the form of a table, graph, or diagram.
It's no secret that there are already many, time-tested libraries & tools out there capable of making highly complex, beautiful charts & more - many offer a multitude of data visualization options.
Some of my favorites:
- Chart.js
- a feature rich, modular library for crafting many types of charts with tons of options
- d3.js
- one of the most powerful data visualization options out there, going way beyond charts
- ApexCharts.js
- a nice and cohesive chart creation lib with everything you need to create a range of charts
-
I used this way back in the day where it was totally free - looks like they have an enterprise paid license now, good for them!
I have fun making any sort of visuals, and a good visual can really say a lot! But you know what else I've really come to appreciate? Simplicity! And while not a library, I do find myself utilizing google sheets quite a bit, and I came across the SPARKLINE function.
While I haven't had a ton of opportunities as of late to utilize it, I was impressed by how simple it could be to use, and how much it could add in terms of conveying information. Let's look at some examples.
Consider that you have the following dataset:
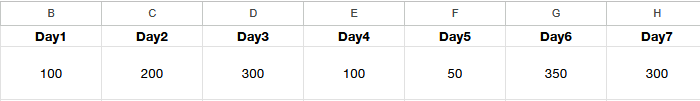
Now if you wanted a sense of how the data was trending, or changing over those cells you need to read each one to get that sense, which is fine. But what if you had 30 different columns, or what if the exact values weren't important? Or you just want to speed up that process?
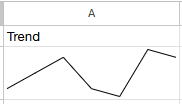
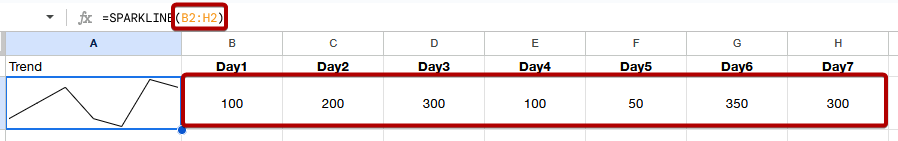
Well this would help you glean that same information much quicker:
If you've used sheets before, you know making a chart is typically possible though not always the most cohesive experience. You highlight your data, go to "insert", choose "chart" then the type, and configure the various options. Which isn't terrible, it can also do more - but sometimes less is more.
So that line graph though is within it's own cell, not floating on the sheet. And how does SPARKLINE come into play? Well, that's all it takes!
Not a bar chart, but we can make it one with just a little bit of configuration:
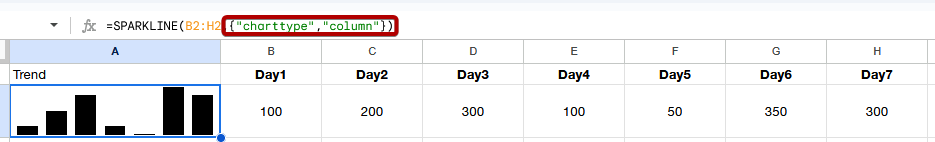
Just by adding that second argument, {"charttype","column"} it's a whole different visual! But that's not all it can do, there's a bunch more configuration options, and even a couple more chart types docs here! and that sort of "effort in" to "value out" is what I'm aiming for here.
So why toomanycharts? Time! I hope to create something that saves developers time,I want a library that can make meaningful simple charts, with trivial effort required. I hope this library is something more of a useful tool for quick & simple chart creation, whether it be a small panel in an admin dashboard, a placeholder until there's time to create a better chart, or even a debugging tool.
If you're curious of what's to come, check out the Roadmap page for what I'm thinking of what's to come.