Barchart Stacked Examples
The first chart type
barchartStacked
Time for some stacking!
Fully in-chart labelling yet to be fully settled on.
Basic Examples
Simple usage for simple results
Minimal Example
const myStackedChart = barchartStacked({
  data: [
    [50, 100, 30],
    [10, 10, 10],
    [100, 150, 50],
  ],
});

document.body.appendChild(myStackedChart);
Imbalanced Datasets
The data sets don't need to match up in size, here the middle bar only has one datapoint:
barchartStacked({
  data: [[50, 100, 30], [100], [100, 150, 50]],
});
With Labels
barchartStacked({
  data: [
    [50, 100, 30],
    [100, 15, 30],
    [100, 50, 50],
  ],
  labels: ['foo', 'bar', 'baz'],
});
Coloring
Coloring stacked barcharts is just as simple as normal barcharts.
Alternating Colors
Colors are used in a continuos manner (1-2-3-1-2-3 etc) so you can provide as few or as many colors as you'd like.
barchartStacked({
  data: [
    [50, 100, 30],
    [100, 15, 30],
    [100, 50, 50],
  ], //     cyan      magenta     red
  colors: ['#ff00ff', '#00ffff', '#dd0547'],
});
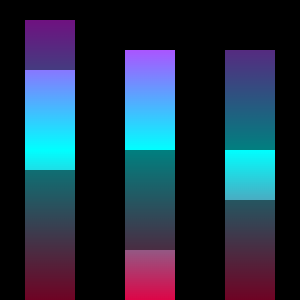
Gradients
Gradients also work the same:
barchartStacked({
  data: [
    [50, 100, 130],
    [100, 100, 50],
    [100, 50, 100],
  ],
  gradientColors: ['#ff00ff', '#00ffff', '#dd0547'],
  gradientDirection: 'top-to-bottom',
});
Though you'll want to be mindful of the gradient's gradientDirection parameter as all segments receive the same gradient, so if it's going in the same direction as the bars longer side it will look like one continuous bar instead of segmented:

Continuous gradients also work, though this makes it almost impossible to tell the segments apart. Though this can be mitigated with CSS!

barchartStacked({
  data: [
    [50, 100, 130],
    [100, 100, 50],
    [100, 50, 100],
  ],
  gradientColors: ['#ff00ff', '#00ffff', '#dd0547'],
  gradientDirection: 'top-to-bottom',
  gradientMode: 'continuous',
  barClass: 'mybars',
});
Of course that's not the only way of using CSS to differentiate the segments:
.mybars:nth-child(even) {
  opacity: 0.5;
}
Animation
To be filled in, though the idea would be the same as barcharts - except you'd need to stagger the animation & delay it so that they play in sequence per-segment. Unless you want each bar appearing at once then it's identical.